
Six Years in Five Weeks
I've tried every tool, every spreadsheet, every platform. Nothing worked for Standards Based Grading the way I needed it to. So I finally built my own.

Another real Diparture from what you’re used to reading on here. No photography, vintage finds, or cultural analysis. But, if you’ve been following along, you know teaching is woven into everything I do. This is a story about finally solving a problem I’ve been carrying for a long time. If you’re a teacher and have stumbled across this sub, this one is for you. If you’re not, come along for the ride anyways…
It’s the middle of April.
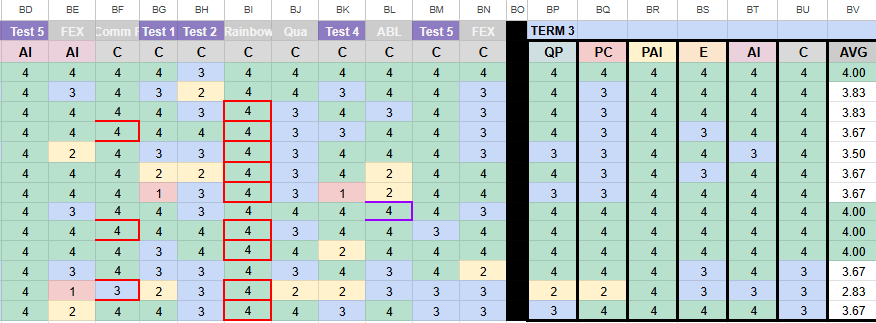
I am staring at my gradebook in Google Sheets. It’s a wall of colour and numbers. Organized by competencies, numbers which translate into standards, which are conditionally formatted. Student by student I drag columns over, analyze their progress through the last three terms, and try to determine one single standing after having assessed five tests and five labs over the last few months. I believe in this method, but the gradebook continues to be the wall.
Online, no solution exists. More spreadsheet templates, or software that’s intended to be sold to an entire school board. Nothing that suits my needs specifically.
I have been struggling with this final step: looking at a year’s worth of assessments and landing on one honest evaluation.
I’ve spent years rewriting my notes. Rewriting my tests. Rewriting my labs. All to just hit this same wall.
Can I finally make the gradebook I’ve been needing?
I’ve always been chasing the right tool to get the job done. I’ve always had faith in the progress of technology to make things quicker or more efficient. But often, especially in education, I find limitations when that tech is missing that “next thing”. Or frustrations, when the tech is bulky or seems to get in the way instead of adding efficiency.
When I started teachers college, we got trained in Smartboard operation. An expensive piece of tech that often was more problem than a solution. Then, by the end of my first year teaching (just two years after), the school I was working in replaced all Smartboards with TVs and touchscreen laptops. Training up, followed by detraining.
The free resources follow the same pattern. Many were built by passionate educators, but without proper investment or resources, they end up stalling out or becoming quite limited or outdated.
I’ve always wanted more than what existed, or wanted to build it my way.
So I’d start a coding-academy program. I would start to build rudimentary programs, thinking eventually I’d be able to build my own chemistry simulations, my way. But, I would always hit a wall. Time and my own limitations would get the better of me and I’d settle for what was already out there.
I was starting to feel the same way about AI lately as well. Sure it was an amazing tool for editing report card comments, but its limitations when it came to actually making things more efficient for me as a teacher, were evident.
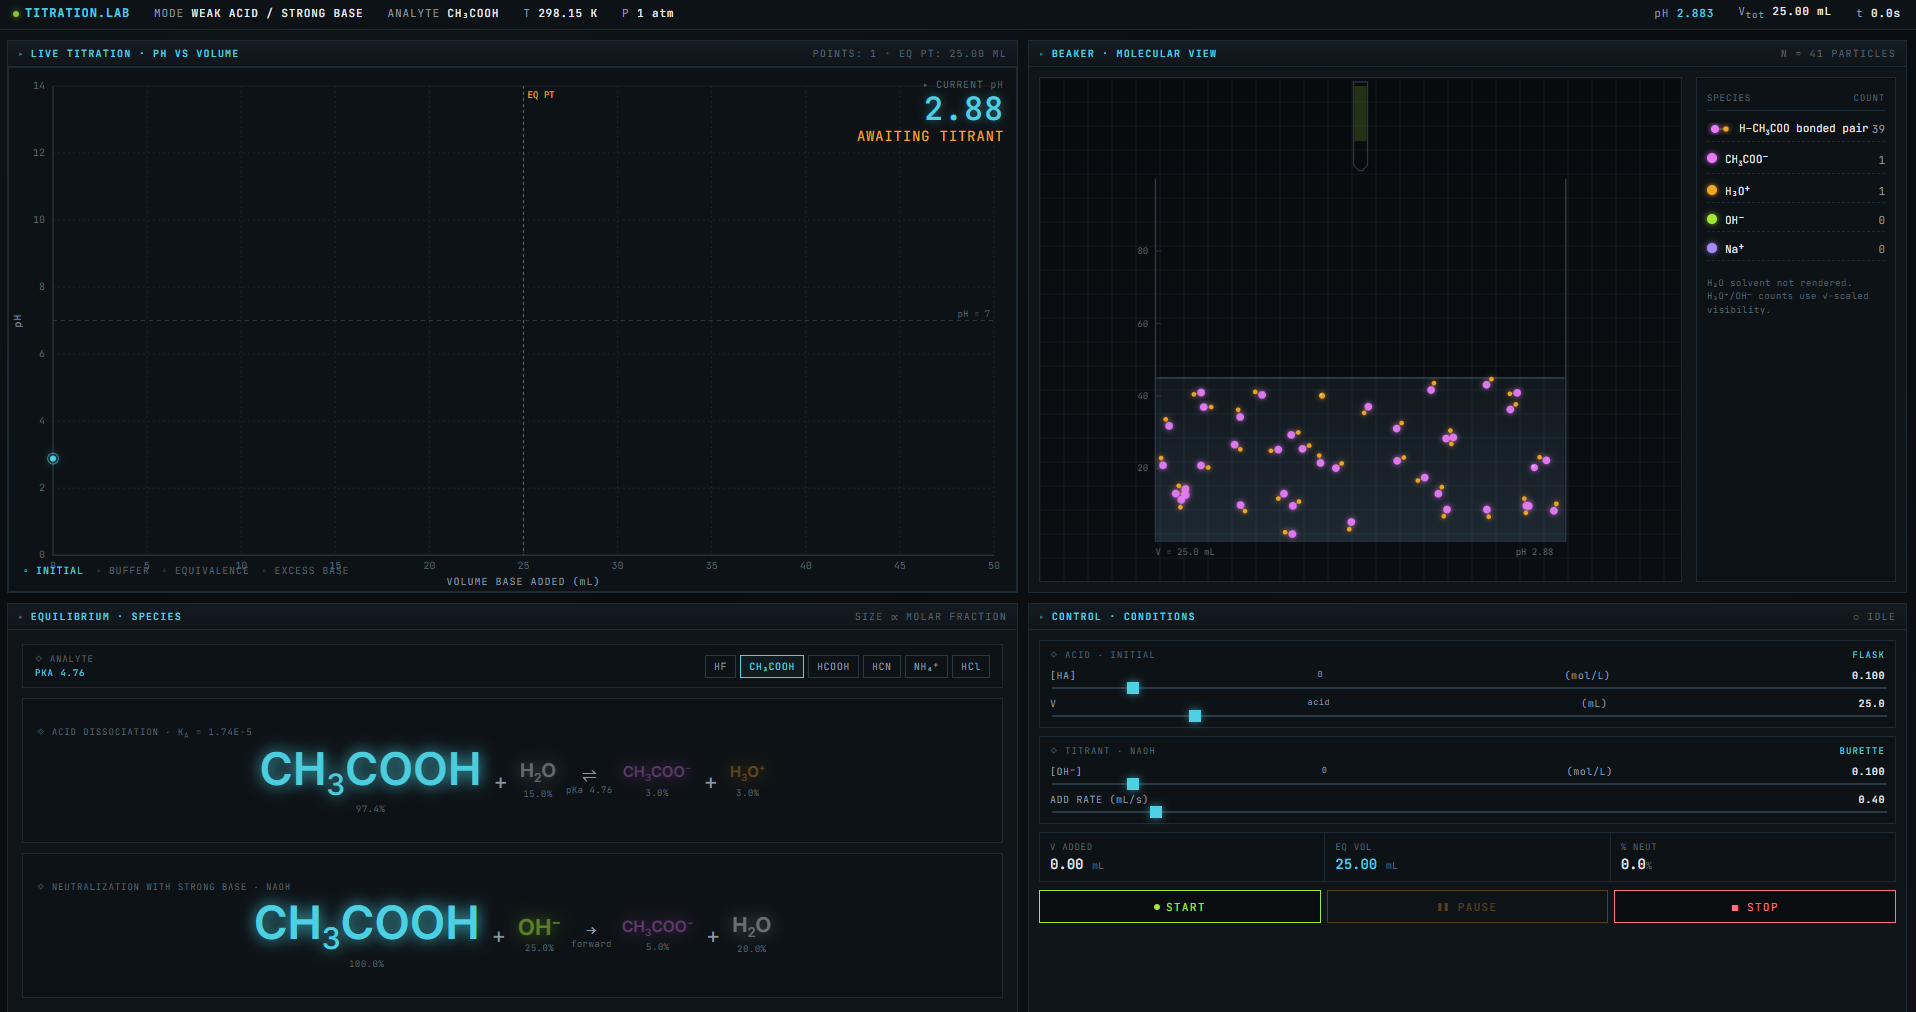
Then I saw it, Claude Design. I came across a random YouTube video of someone using text prompts to make a fully developed web app. I entered with skepticism, most things AI haven’t panned out to the promise. I started with a titration simulator.
I knew exactly what I wanted. I’ve been drawing titrations on the whiteboard and tablet for thirteen years. Showing molecular views, equations, and graphs, “simultaneously”. But never being able to show them simultaneously.
I built my prompt well, included some screenshots and data, and was blown away by the first pass. I was hooked.
I ran out of tokens on my lunchbreak.
Six years ago I started to shift to Standards Based Grading (SBG). It’s taken me that entire time to adapt all of my classes to be SBG. From lessons to assessments all the way to reports. In BC, the curriculum is built for it: competencies are the skills, content is the vehicle. Instead of memorizing how to calculate pH, I encourage the students to develop their ability to analyze cause-and-effect relationships, using acids and bases as the context.
It has converted my teaching focus for the better. My lessons are developed around presenting challenging concepts in a way that frames them in the skill required to solve them. What traditionally would be “needing this information for the upcoming test” has changed into “how can we use our knowledge and skills to develop a research question and hypothesis?”.
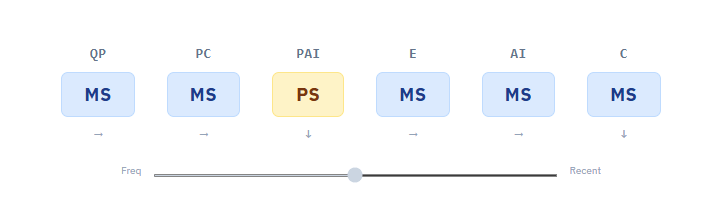
Practically, SBG means assessing students on a four-point scale. In my classroom: ES (excels at the standard), MS (meets the standard), PS (partially meets the standard), NS (not meeting the standard). The goal is to reduce a hundred-point scale down to four, increasing clarity and decreasing grade-grubbing. We still have to convert to a percentage at the end of term (universities aren’t there yet) but the day-to-day work stays focused on skills, not scores.
My 11s and 12s still ask about their percentage, but now I have better questions and conversations to redirect them with.
At the end of a term or year, for the report, the data must be consolidated by considering their most recent and most frequent. We consider all the evidence from the year, but weigh recent performance most heavily. The grade should represent where a student is right now, not where they started. This pushes growth, keeps students engaged through to the end of the year, and allows the testing of the skills to get increasingly difficult to really push their abilities as the year progresses.
The pedagogy and mentality are half the battle, and I’ve loved taking it on.
The other half, which has been even more challenging in my opinion, is the gradebook.
One of our LMS (Schoology) still reports a 1, 2, 3, or 4, and students immediately convert that to a percentage, even though it isn’t the true one. It doesn’t allow multiple instances of the same competency, which makes it useless for tests that hit one skill several times. I’ve been emailing them about a fix to this for years, with not even a response to tell us they’re working on it back.
My Google Sheet works, but is daunting to restart every year. By the end, it’s a wall of conditional formatting that overwhelms anyone I show it to.
Most recent and most frequent is supposed to be the standard for final assessments, but it still comes down to dragging columns across a spreadsheet and trusting my gut.
No tool makes it easy, yet.
If I can make a titration simulator…surely I can make a gradebook?
So I started the prompting; ran out of tokens…again.
I keep investigating, surely there has to be a more efficient way.
Here comes VSCode. More progress; less tokens.
I start building again.
Make progress. Run out of tokens, again.
Find a new program, Cursor, more powerful, even less tokens.
Make more progress.
Within a week, I have a decently working gradebook program. It has classes, it let’s me add assignments, it’s saving the data…and it hasn’t crashed yet. The only thing left to do was test it.
I can’t go back in and re-input all my grades, that would take me forever…better build an import function…
This is all saved locally on my browser…seems risky…better build a back-up function…
It would be cool to add anecdotal notes…a discussion tracker…a way to copy assignments and competencies across classes…export student progress into a one page summary…
It goes on like this for a few weeks. Any idea I have, I can now do. Every time I have to open my gradebook to add a new assessment, I am going to my web app rather than my Google sheet. That’s a good sign.
It hasn’t crashed yet. I keep adding features. Settings, colour coding, customizations anticipating what other teachers would want to see.
No more emailing software teams. No more complaining. Just fix it. Just build it yourself.
By the end of it, I have a fully functioning gradebook that I am using almost daily. I am trying to make improvements, but I can’t think of anything else.
Then the next opportunity for a big test of my program comes up. Term three reports.
I load up the first student and see what summary of grades it is giving. I already disagree with how the formula we made has determined it is going to weigh “most recent and most frequent”. So I go back and try to fine tune it.
I try a few things, making a slider so that I can tune which one is weighed heavier, making some logic rules, looking up some rules online, but so much of it is left to professional judgement, nothing is really hitting the mark…
So then I start giving Cursor (the AI agent) examples.
PS, PS, PS, MS, MS, MS, ES…What would you give it? What would I give it? Okay, let’s try another one…
MS, PS, MS, PS, PS, ES, MS, ES, MS, ES, ES….
It goes on like this for a few minutes, and finally we start aligning.
The formula we landed on wasn’t something I could have written out at the start. But I knew it was right the moment I saw it, because I’d been doing this by eye for six years.
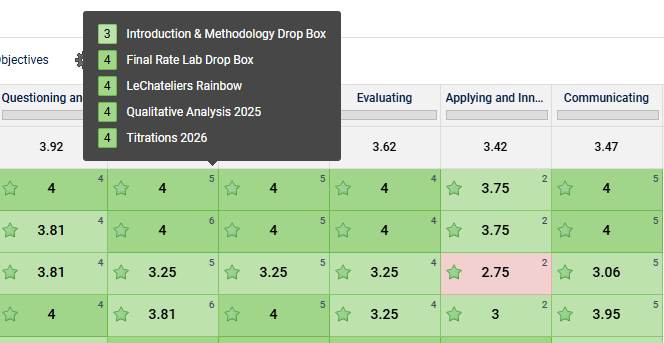
Instead of dragging columns around a spreadsheet, I open a single student view. I can see their current standings, their progress in a single or multiple competencies, any recent notes and assessments, and a customizable graph which can show the trends through the year.
Now, when a student asks “can I know my grade right now”, I don’t have to hesitate or shroud anything in some sort of mystery. It is their progress, they should be able to see it. I can easily print a summary for them, or pull up the student view, rather than having to show the entire classes data and awkwardly try to hide other students information.
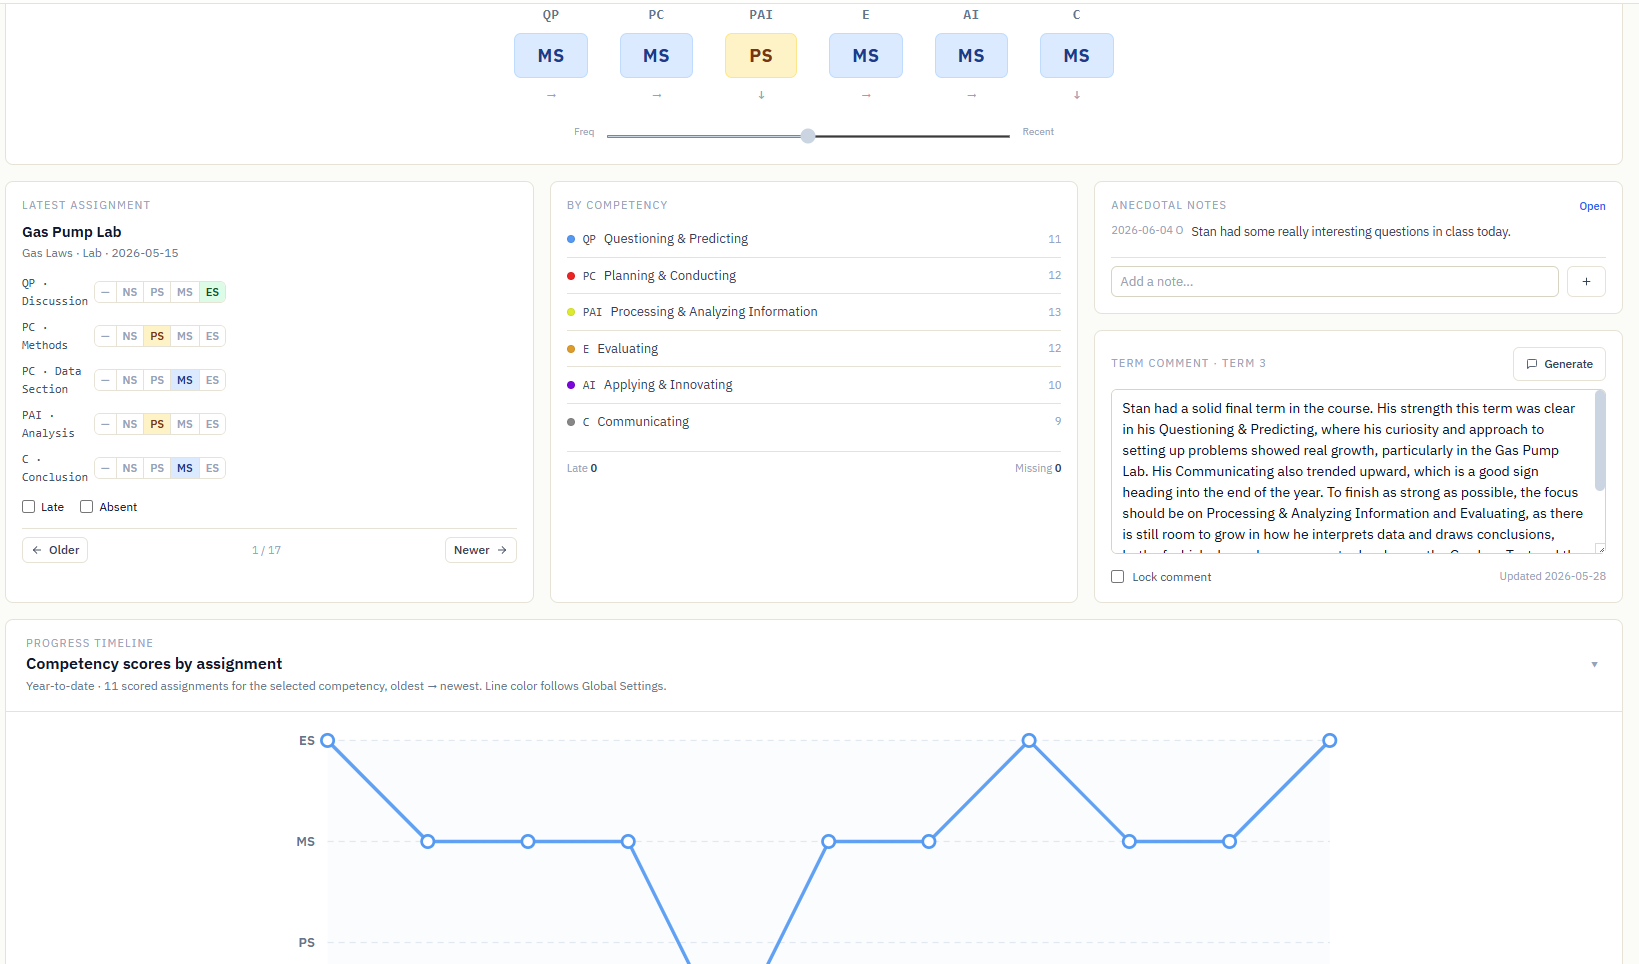
As I continue to sharpen my understanding of how the most recent and most frequent should play into the final mark, I can tune how the formula calculates it. I’ve added a feature that teachers can tune it their own way, and test their logic. The formula does the heavy lifting, but the final call stays with me.
I’ve also maintained some features that entering grades into a spreadsheet did well, like using numbers to enter ES, MS, PS, NS to continue to make gradebook entry quick and easy after a test.
I no longer have to sift through my entire school’s library of competencies to finally get to the ones I need for each assignment. I can customize my gradebook to have the colour coding and competencies I need, for each class, or copy over to different classes.
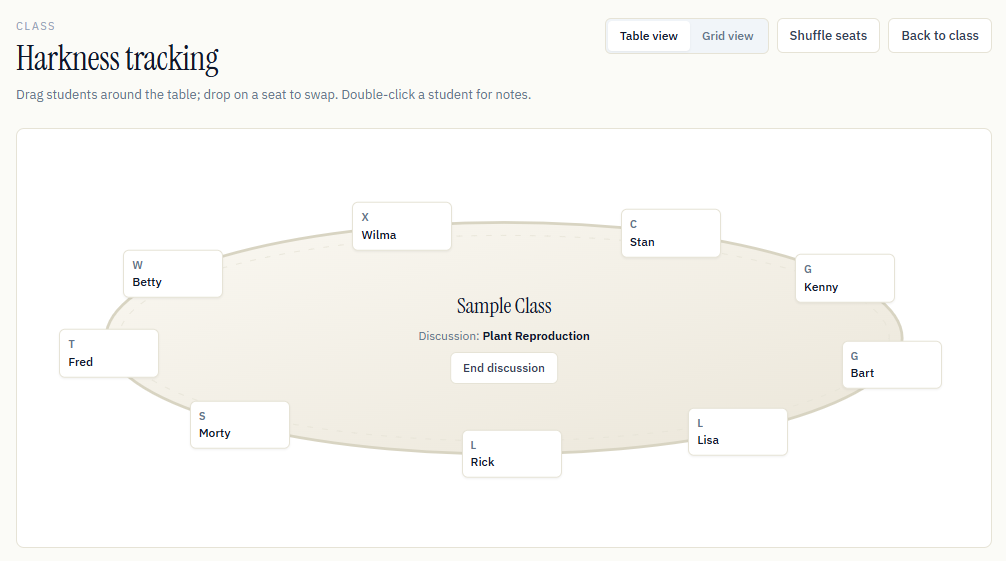
After a staff meeting a colleague showed how she was scribing discussion notes, and I built in a way to do the same thing. Seating plans, anecdotal notes, discussion hot keys, all in one place.
Finally, and usually the feature that has been perking most teachers ears, is the built in comment maker. If a teacher wants, they can put in an API key and include some instructions. From there, the gradebook can consolidate the competencies, anecdotal notes, and instructions into a single report card comment, on demand.
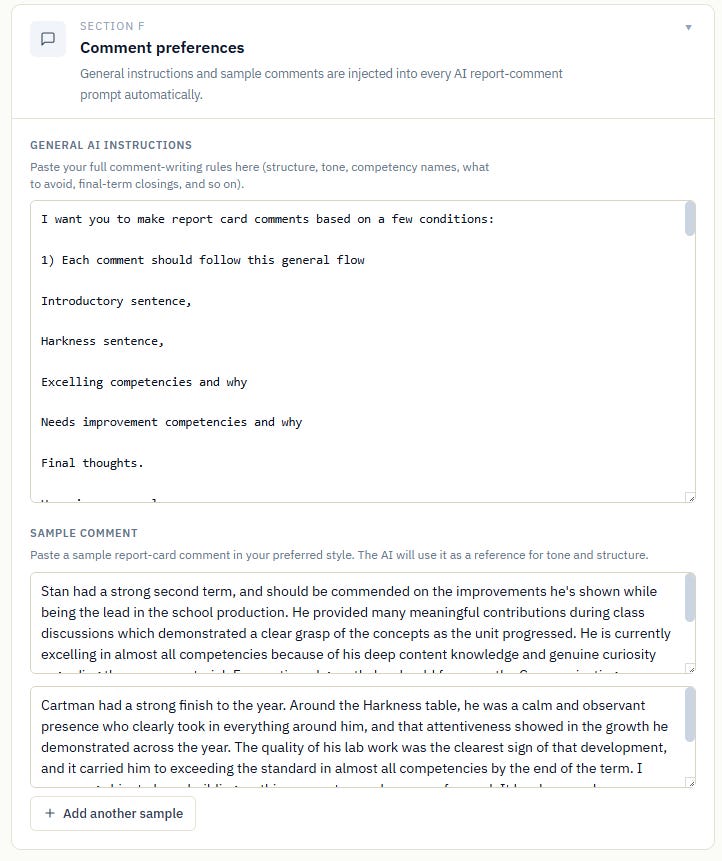
The teachers spend the entire year collecting the data. The anecdotal notes are ours. The assessments are ours. The API key just consolidates what’s already there into a first draft. One I can tune and approve before it goes anywhere. The AI isn’t doing the work, just the paperwork.
It happened fast. So fast that I started to doubt the whole thing. It only took a few weeks to make. Maybe it isn’t worth anything.
But that’s the wrong way of looking at it.
This is thirteen years in the making. Thirteen years of reading lab reports, marking tests, assessing discussions, writing comments. Six years of struggling with redoing my entire way of delivering and assessing content. I was able to build it quickly because I knew exactly what I needed, not because the AI agents did the thinking for me.
You could build your own version too, and I genuinely encourage it. The file is hackable, the methodology is yours to tune, and the AI tools to do it are more accessible than ever.
But I also invite you to try this one.
For the next four days, I am running a 50% off sale for readers of the Substack. No discount code needed. Sale ends Sunday!